
The interest rate on a savings account is not the whole story. What matters is the real return: the gap between the rate you earn and the rate at which prices are rising. NS&I gives a simple example: if you have £100 saved and your interest rate is 3.5%, you will receive a total of £3.50 in interest over the course of a year1. But if prices rise by more than 3.5% over the same year, that £103.50 buys less at the end of it than your £100 did at the start. As NS&I puts it, "if inflation is higher than the interest rate you earn, the spending power of your savings may still decrease"1.
That is the situation many savers have faced at points over recent years. The CPIH measure of inflation stood at 3.1% in the 12 months to July 20262, and the CPI measure was also 3.1% in the 12 months to August 20263. Any account paying less than that was losing value in real terms, whatever its headline rate suggested. This page explains how to work out a real return, which inflation measure to compare against, how Bank Rate drives the rates banks pay, and where real returns go wrong.
What a real return is: your savings rate minus inflation
A real return is the interest you earn after inflation has taken its share. The arithmetic is simple: subtract the inflation rate from your savings rate. If your investment grows by 8% but inflation is 5%, your real return is only 3%. The effect on cash is easier to see in money terms: if the rate of inflation is 5% over one year, and you have £10,000 earning 1%, your money will be worth £9,600 at the end of the year. This is what is meant by a negative real return, and it is why "has inflation reduced my savings" is a fair question even when the balance has gone up.
Two things complicate the sum in practice. The first is tax. Interest on savings counts as income, and from 6 April 2027 the savings basic rate of tax will be increased to 22%6, with the savings higher rate rising to 42% and the savings additional rate to 47%7. Tax reduces the interest you keep, so the real return should be worked out on the interest you actually receive. Money held in an ISA avoids this problem, because ISA interest is not subject to income tax.
The second is which inflation figure to use. The headline CPI rate is the one most often quoted, but it is an average across the whole economy, and your own cost of living may rise at a different pace, as explained later on this page. The ONS also publishes Household Costs Indices, which measure inflation as different groups of households actually experience it8.
Real returns are not a new concern. The ONS records that UK household spending saw "a real-terms increase of £15.40 (3%)" in the financial year ending 2024 after accounting for inflation9, a reminder that official statistics routinely strip out price effects to show what has really changed. The same logic applies to your savings: the number that matters is not the interest credited to the account, but what that money will buy.
How inflation is measured: CPI, CPIH and RPI
The UK has three long-standing consumer price measures, and they differ in ways that matter when you are comparing them with a savings rate.
The ONS describes CPIH as "our lead measure of inflation, based on economic principles"2. CPIH includes owner occupiers' housing costs and Council Tax, which are excluded from the CPI, making it the most comprehensive measure10. CPI, in turn, "is used by the government for inflation targeting, and for uprating state pensions and benefits"10. RPI is the oldest of the three, providing estimates of inflation from 1947 onwards, with the first official release of consumer price inflation produced in January 195610.
| Measure | What it covers | Where it is used |
|---|---|---|
| CPIH | CPI plus owner occupiers' housing costs and Council Tax10 | The ONS lead measure of inflation2 |
| CPI | All households' and visitors' spending, excluding owner occupiers' housing costs10 | The Government's 2% inflation target and uprating pensions and benefits10 |
| RPI | An older formula, calculated on rounded published indices10 | Some legacy contracts; being reformed from 2030 at the earliest3 |
The measures are calculated differently as well as covering different spending. Rates of change for CPIH and CPI are calculated from unrounded index levels, while RPI rates are calculated from the rounded published indices10. At the elementary level, stratum indices use predominantly the geometric mean for CPIH and CPI, and arithmetic means for the RPI10. These differences mean RPI tends to show higher inflation than CPI, which is why some index-linked products historically tied to RPI looked more generous than they really were.
That point has practical consequences for savers. NS&I Index-linked Savings Certificates were once linked to RPI, but NS&I states that "if you decide to renew any Certificates that mature, your index-linking will then be calculated using the Consumer Prices Index" instead11. Elsewhere, the Pension Protection Fund uprates payments in line with CPI, capped at 2.5% a year for service accrued after 6 April 199712. When a product promises inflation protection, the measure it uses is part of the deal.
The RPI itself is being brought into line: following a 2020 consultation, CPIH methods and data sources will be introduced into the RPI from 2030 at the earliest, and its supplementary and lower-level indices discontinued3. The dedicated guides to CPI and CPIH, RPI and CPI versus RPI cover each measure in more detail.
Inside the inflation figure: a basket of about 760 goods and services
The inflation rate you compare your savings against is built from a very large collection of individual prices. The ONS compiles its consumer price indices from a representative sample of approximately 760 goods and services, reviewed annually10. Prices are collected monthly, usually around the second or third Tuesday of the month10.
The scale of the operation is worth knowing, because it explains both why the figures are trusted and why they are averages rather than a description of anyone's own basket:
- Around 180,000 price quotations are collected each month10
- Local price collectors visit 20,000 shops in around 150 locations to collect over 100,000 prices10
- Around 160 items are collected centrally, including rail fares, second-hand cars and much of the grocery market, which use large alternative data sources10
- The weights given to each category come from household spending surveys, including the Living Costs and Food Survey, a continuous survey of around 6,000 households a year10
The basket is reviewed annually so it keeps up with how people actually spend: items that fall out of favour are dropped and new ones added. The weights are "plutocratic", meaning richer households' spending patterns carry more weight in the average, because the indices aim to measure the whole economy's spending13. That is one reason your own inflation rate can differ from the headline, a point covered in its own section below. The full detail is on the page about the inflation basket.
Bank Rate and the 2% inflation target
Bank Rate is the single official interest rate that anchors everything else, including what banks pay savers. The Bank of England defines it as "the rate of interest we pay to commercial banks, building societies and financial institutions that hold money with us"14. It is the core interest rate in the UK, and setting it is the Bank's job15.
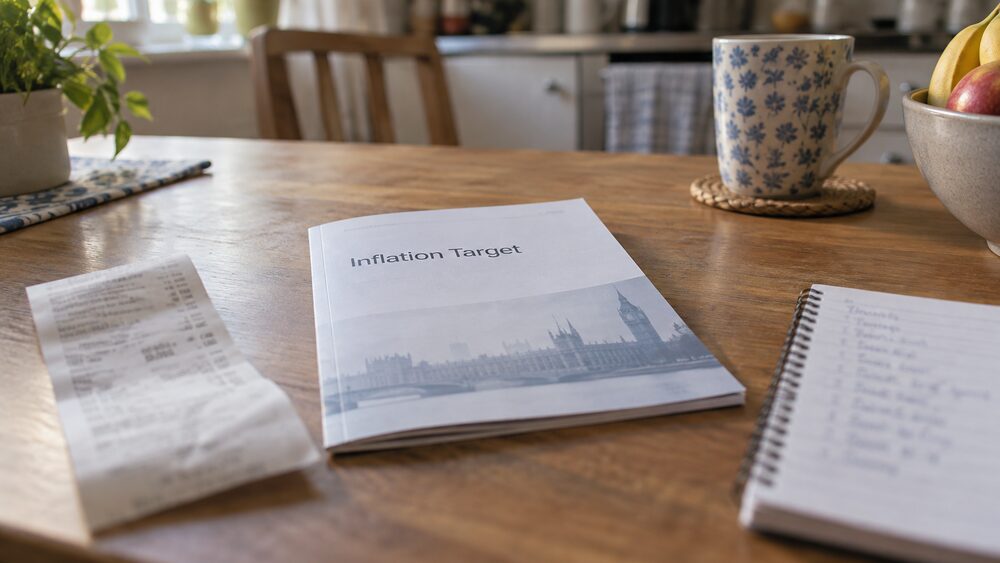
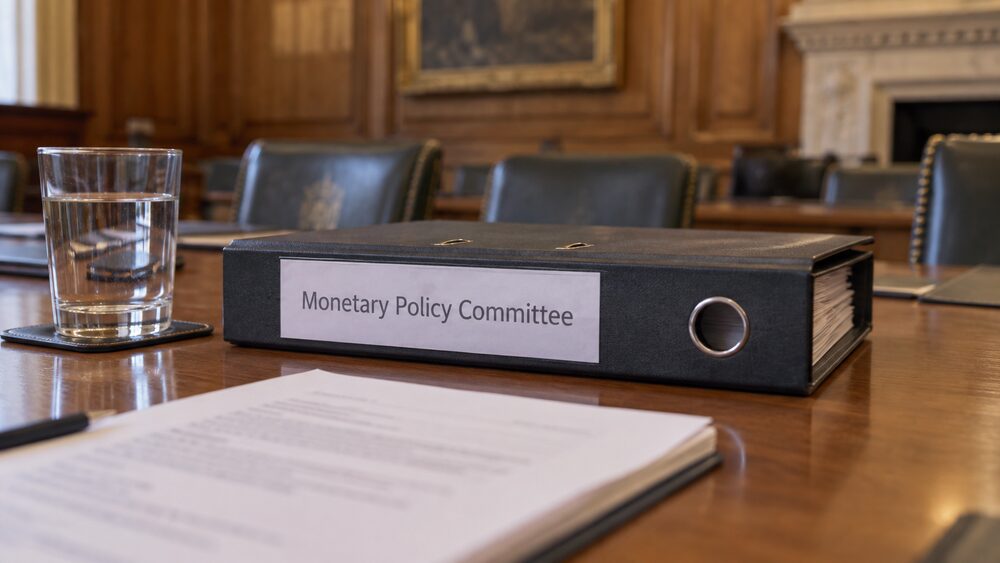
The Government gives the Bank a target for inflation: "The Government sets us a target of getting inflation to 2%"4. The Monetary Policy Committee (MPC) moves Bank Rate up or down to keep inflation near that target, raising it to cool spending and cutting it to encourage it. The Scottish Government's figures illustrate how this has worked in practice: from a peak in October 2022, CPI gradually reduced to reach the Bank of England's target rate of 2% by June 202416, after a period in which the Bank's forecast had been for inflation to rise to 2.8% in 2025 before easing back towards 2%17.
The target is symmetric in an important way for savers: 2% inflation is the aim, not zero. Even when the Bank hits its target exactly, cash savings need to earn more than 2% just to stand still in real terms. In the years between 1975 and 2007, Bank Rate ranged from 3.5% at its lowest point to 17% at its highest4, a reminder that both inflation and the official response to it have varied enormously within living memory. The pages on the 2% inflation target and the Monetary Policy Committee explain the mechanics.
How Bank Rate feeds through to savings rates
Bank Rate does not flow to savers automatically. It is the rate the Bank pays to high street banks that hold money with it, and it therefore influences the rates those banks set for their own customers15. For a saver, the interest rate, or savings rate, tells you how much money will be paid into your account, as a percentage of your savings15. What that percentage is, and how quickly it follows Bank Rate, depends on the type of account.
Tracker accounts follow a named reference rate. FCA rules require a firm providing a savings account that tracks a reference interest rate to indicate how the rate is calculated and to direct the customer to where the level of the reference rate can be accessed from time to time20. Other variable accounts can be changed at the provider's decision: NS&I, for example, states of its Direct Saver that "the rate is variable so we can change it up or down from time to time, for example when the Bank of England base rate changes or when rates in the general savings market change"21, and its Direct ISA carries the same terms22. Fixed-rate accounts hold their rate until the term ends, whatever Bank Rate does in the meantime.
FCA rules also govern transparency. A firm must publish the current rate of interest that applies to each savings account it provides on its website, including accounts no longer open to new customers, and keep it continuously up to date20. The summary box that accompanies a savings account must set out the rates that apply, the circumstances in which different rates apply, details of any reference rate tracked, and when interest is calculated and credited23. Since April 2017, firms should also ensure the rate of interest is prominently shown alongside any account balance information in statements, online banking and rate change notifications24.
So when Bank Rate is cut, a variable savings rate may follow, but not instantly and not by the same amount. The Bank notes that central banks usually change their rates by 0.25%, but it can alter Bank Rate by as little or as much as it needs to14. How much of any change reaches a particular account is a commercial decision by the provider, within the disclosure rules above. The savings section covers account types, and average savings interest shows what savers have typically earned.
When savings beat inflation and when they fall behind
Whether savings beat inflation depends on the gap between the two at any moment, and that gap has swung widely over the past two decades.
In the long run, household wealth has more than kept pace: the ONS found that the rate of growth in private households' wealth in Great Britain in the two survey periods to April 2016 to March 2018 was higher than in the previous four periods, at 12% and 11% above inflation25. But the experience within shorter periods has been mixed. The household saving ratio rose from just over 4% in 2008 to over 11% in 2010, dropping to 7% in 201226, a period in which Bank Rate was held at very low levels and cash savings generally lost value in real terms.
The pandemic years were unusual in the other direction. By the end of the pandemic in Quarter 4 2021, the accumulated value of excess saving held in currency and deposits amounted to 9.7% of annual total resources27: households saved heavily because spending opportunities were limited, and much of that sat in cash. What that cash earned afterwards depended entirely on where it was held when rates began to rise.
The pattern since then has been a story of catch-up. Bank Rate rose from 0.1% in December 2021 to 5.25% in August 202328, and the ONS records the Bank increasing the bank rate 13 times from 0.25% to 5.25% between January 2022 and August 202327. Savers willing to move money into accounts paying the new, higher rates could again earn positive real returns once inflation fell back towards the 2% target. Those who left money in long-standing accounts paying old rates did not.
Benefits and pensions show the same mechanics from the other side. The April 2022 benefits uprating used an inflation reference point with a seven-month gap before the increase took effect29, and the OBR noted that high inflation in 2022-23 temporarily reduced the real value of benefits, including those for pensioners, by £12 billion before they largely caught up with inflation the following year30. Any payment or saving linked to inflation with a lag loses real value while inflation is rising, and gains while it falls. The cost of living crisis page covers that period in full.
From 0.1% to 5.25%: how Bank Rate has moved in recent years
The recent history of Bank Rate is a full cycle from near zero to a peak and most of the way back down.
The rise was steep and fast: from 0.1% in December 2021 to 5.25% in August 202328, a series of increases the ONS counts as 13 rises from 0.25% at the start of January 202227. The Bank of England's December 2023 Financial Stability Report recorded Bank Rate at 5.25% at that point16.
The way down has been more gradual, and the sources describe it slightly differently. Scottish Government figures state the Bank reduced interest rates twice in 2024, in August and November, from 5.25% to 4.75%16. An independent guide instead describes the base rate being cut four times in 2024, each by 0.25 percentage points, in February, May, August and December5. The two accounts disagree on how many cuts there were and when they fell, so treat the exact path of 2024 as uncertain between these sources.
In 2025 the MPC lowered rates three times, from 4.75% to 4% between January and August32, and the level has been held since December 20255. As of September 2026, Bank Rate is 3.75%4. The Financial Ombudsman Service's own worked examples show the step-by-step path: 4.75% from 15 January 2025 to 5 February 2025, and 4.50% from 6 February 2025 to 7 May 202533. The full record, including earlier decades, is on the Bank Rate history page.
When inflation figures and rate decisions are published
Knowing the calendar helps you check a real return with current numbers rather than stale ones.
Inflation figures are published monthly. The July 2026 consumer price inflation bulletin was released on 19 August 20262, and the next release in the consumer price inflation series is scheduled for 21 October 202634. The ONS states that publication takes place four or five weeks after the price collection, and has never been delayed or missed10. Future publication dates are given long in advance: the ONS maintains the practice of advance notice of a minimum of 18 months to a maximum of 30 months10.
Rate decisions follow their own rhythm. The MPC usually votes on Bank Rate eight times a year5, and the Bank publishes its Monetary Policy Report every three months4. Before MPC meetings, the Bank may be granted exceptional pre-release access to an estimate of consumer price inflation data: it received such access at 10:00am on Monday 14 September 2026 ahead of the Monetary Policy Committee meeting35. The committee also has the power to make unscheduled changes to the base rate if it thinks it necessary5, so the calendar is a guide, not a guarantee.
Other figures useful to savers appear on their own schedules. The Government's annual savings statistics are released annually in September36. The latest inflation figures page carries the current numbers and the publication calendar.
Why your own inflation rate may differ from the headline
The CPI rate is an average across all households' spending, and no household is average. The ONS's Household Costs Indices (HCIs) exist precisely to show how inflation differs between groups, and their findings are reassuring in some respects and not in others.
Over the past five years to June 2026, cumulative inflation has been similar for high-income and low-income households, at 32.8% for high-income households and 32.7% for low-income households8. But the composition differs. Owner occupiers' housing costs contributed 0.09 percentage points to the difference between the HCI and CPI annual rates in June 20268, and non-retired households saw a greater inflationary contribution than retired households from private rentals, of 0.18 percentage points8. The gap between the HCI and CPI annual inflation rates for all households was 0.2 percentage points in June 20268.
The HCIs also treat housing differently from CPIH itself: mortgage interest payments in the HCIs are calculated using the Retail Prices Index model, which estimates interest due on a representative stock of mortgages for an average household13. So a homeowner with a mortgage, a tenant and someone who owns outright experience inflation differently, and each should compare their savings rate against the costs that dominate their own budget. The Household Costs Index page covers the detail.
Where real returns can go wrong for savers
Several things can quietly turn a positive-looking savings rate into a loss of buying power.
The first is inflation risk on fixed terms. MoneyHelper warns of fixed-rate savings bonds that "your original investment won't hold its value in real terms (its 'buying power') if the interest you're getting is less than the rate of inflation over the investment period"37. A fixed rate that beats inflation on the day you open the bond may not beat it two years later, and you cannot switch without giving up the term.
The second is moving up the risk scale without meaning to. An ISA invested in stocks and shares rather than cash carries the warning that "the value of your investments can fall as well as rise, and you may get back less than you put in"38. Beating inflation is not guaranteed by any product, and the same risk is acknowledged in pension drawdown, where the value of a drawdown fund is at risk of being eroded by inflation16.
The third is tax eating the margin. From 6 April 2027 the savings basic rate will be increased to 22%6, with the savings higher rate at 42% and the savings additional rate at 47%7. A real return of 1% can become negative once tax is deducted from the interest.
The fourth is inertia. As the Bank Rate timeline above shows, rates have moved across a very wide range since 2021, and accounts that were competitive when opened often were not later. FCA rules require firms to publish the current rate for every savings account, including those closed to new customers20, so the information needed to check is always available. Free, impartial help is at hand too: MoneyHelper, a government-backed service, explains savings options including cash savings bonds37, and the Financial Ombudsman Service can consider complaints about interest, including its guidance on interest awards from January 202633. The savings section and the rates and economy hub carry the next steps.
Sources38 cited
- Saving your extra money NS&I
- Consumer price inflation, UK: July 2026 Office for National Statistics, 19 August 2026
- Consumer price inflation, UK: August 2026 (PDF) Office for National Statistics, 2026
- Current interest rate Bank of England, 17 September 2026
- Bank of England base rate and your mortgage Which?, 23 June 2026
- Budget 2025: overview of tax legislation and rates HM Treasury, 2025
- Income tax: changes to tax rates for property, savings and dividend income HM Government, 27 November 2025
- Household Costs Indices for UK household groups: April to June 2026 Office for National Statistics, 2026
- Family spending in the UK: April 2023 to March 2024 Office for National Statistics, 2024
- Consumer price inflation, including all 3 indices (CPIH, CPI and RPI) QMI Office for National Statistics, 25 March 2026
- Index-linked Savings Certificates NS&I
- Will my payments increase Pension Protection Fund
- Calculating the Household Costs Indices Office for National Statistics, 28 May 2026
- Inflation and interest rates FAQ Bank of England, 4 February 2026
- What are interest rates Bank of England, 30 July 2026
- Understanding the cost of living crisis in Scotland, page 6 Scottish Government, 12 February 2025
- Understanding the cost of living crisis in Scotland (PDF) Scottish Government, February 2025
- Bank of England base rate and your mortgage Which?, 2026-06-23
- What do I need to know about debt? Bank of England, 2025-08-19
- BCOBS 4.1 Financial Conduct Authority, 26 September 2026
- Direct Saver summary NS&I, 18 August 2026
- Direct ISA NS&I, 4 September 2026
- BCOBS 2.6 Financial Conduct Authority
- BCOBS 4 Financial Conduct Authority
- Total wealth in Great Britain: April 2016 to March 2018 Office for National Statistics
- Written evidence on the household saving ratio House of Commons committee, January 2018
- Households' finances and saving, UK: 2020 to 2024 Office for National Statistics, 22 July 2024
- Interest rates: SN04769 House of Commons Library, 8 July 2026
- Benefits uprating summary Work and Pensions Committee, 27 July 2022
- Welfare trends report, May 2022 Office for Budget Responsibility, March 2022
- Understanding the cost of living crisis in Scotland Scottish Government, 2025-02-12
- Scottish Economic Insights, September 2025, page 6 Scottish Government, August 2025
- Guidance on our new interest awards, from January 2026 Financial Ombudsman Service, 26 September 2026
- CPI monthly rate 12.5: Insurance Office for National Statistics, 16 September 2026
- Consumer price inflation, UK: August 2026 Office for National Statistics, 14 September 2026
- Annual savings statistics 2025: background and methodology HM Treasury, 18 September 2025
- Cash savings bonds MoneyHelper, 25 September 2026
- ISA basics NS&I, 1 September 2026




 MoneyHelperFree, impartial money and pensions guidance, set up by government
 Citizens AdviceFree advice on money, consumer and legal problems in England and Wales
 GOV.UKOfficial information on tax, benefits and government services
 StepChangeFree debt advice and solutions from a charity
 FSCSProtects your money if a bank, insurer or investment firm fails