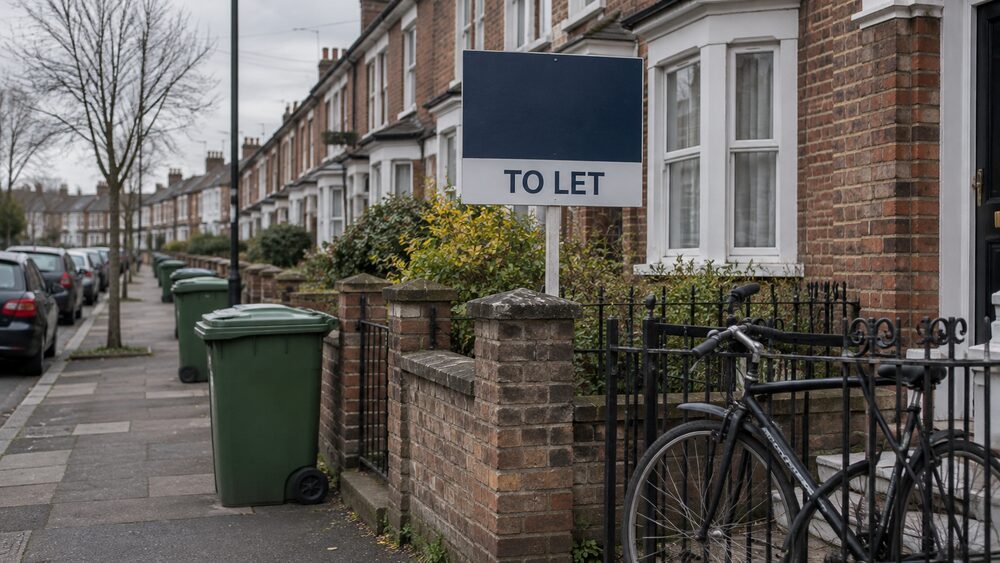
The average monthly private rent in the UK was £1,400 in August 2026, according to the Office for National Statistics (ONS), up by 3.8% on a year earlier1. That figure comes from the Price Index of Private Rents (PIPR), the ONS measure that tracks what tenants actually pay across both new and existing tenancies, and it is the number most often quoted when people ask what rent "normally" costs.
The average moves a little each month as new data arrive. In February 2026 it stood at £1,3742, in July 2026 at £1,3933, and the August figure of £1,400 is itself a provisional estimate that can be revised. Behind the UK-wide number sit large differences by nation, region, property type and bedroom count, which this page sets out, along with how the index is built and why its averages usually sit below the rents you see advertised.
Average private rent in the UK: £1,400 a month
The £1,400 headline is an average across every kind of privately rented home in the UK, so it conceals a wide spread by property type and size. In August 2026 the average was highest for detached properties, at £1,589 a month, and lowest for flats and maisonettes, at £1,3674. By bedroom count the range is wider still: in May 2026 the average UK private rent was £2,056 for properties with four or more bedrooms and £1,123 for one-bedroom properties7.
The one-bedroom figure is the one many single renters and couples look for first. The ONS put the average UK monthly rent for a one-bedroom property at £1,115 in February 2026, £1,132 in July 2026 and £1,136 in August 20261. Where you live matters more than the number of rooms in many cases: Trust for London analysis found the average cost of a one-bedroom home in the private market was £1,620 a month in 2024/25, compared with £1,090 in the rest of England8.
Two cautions apply when reading these averages. First, they mix every region together, so a UK average is pulled up by London and down by the cheapest regions, and may match no local market exactly. Second, the ONS figures are based on achieved rents, the rents tenants actually agree to pay, rather than asking prices on listings, which is one reason they can look lower than the rents you see on a search site. How that works is covered later on this page.
How fast rents are rising
Annual rent inflation has slowed from its peak but remains well above its long-run pace. Average UK monthly private rent rose by 3.8% in the 12 months to August 2026, 3.7% in the 12 months to July 2026, 3.3% in the 12 months to June 2026 and 3.3% in the 12 months to May 2026, all provisional estimates1. In February 2026 the annual rise was 3.5%, or £47 a month2.
The recent slowdown follows an exceptional period. Private rental inflation peaked at 9.1% in March 2024, averaging 8.7% across that year, before slowing to 6.3% in 2025, still much faster than long-term average growth rates12. In the year to March 2024, average annual rents increased at 9.1% in Great Britain, the fastest rate on record13. In the period since the UK general election, rents have risen by an average of nearly 8%, almost £1,200 more expensive per year14, and private rents in Wales have risen by 38% since mid-2021, a greater increase than in England and Scotland15.
For context, these rates are far above what preceded them. In the 12 months to October 2023, private rents rose by 6.1% on average in the UK, an all-time high at that point16. Yet between May 2012 and May 2013, private rental prices grew by just 1.3% in Great Britain17, and after growing by between 1 and 2% a year since 2018, private rents increased sharply over the following 12 months18.
Rises have also been uneven between individual tenancies. ONS analysis reported by Which? found that 50.6% of privately rented properties in England experienced a price increase between February 2022 and February 2023, while 46.6% stayed constant and just 2.8% saw a decrease; of those that rose, the average increase was 9.6%19. In London, two thirds of properties (66.8%) had seen an increase, with the average rise highest there at 12% and lowest in the West Midlands at 8.2%19.
Rent differences across England, Wales, Scotland and Northern Ireland
The UK average blends four very different markets. In August 2026, average monthly rent was £1,459 in England and £846 in Wales1. In May 2026 the ONS reported averages of £1,442 in England, £836 in Wales and £1,009 in Scotland, with annual rent inflation of 3.4% in England, 4.7% in Wales and 1.0% in Scotland7. Scotland's markedly lower inflation figure reflects its rent cap rules during part of this period, which held down increases for existing tenancies.
| Nation | Average monthly rent | Annual change | Period |
|---|---|---|---|
| England | £1,459 | 4.0% | 12 months to August 20261 |
| Wales | £846 | 4.3% | 12 months to August 20261 |
| Scotland | £1,009 | 1.0% | 12 months to May 20267 |
| Northern Ireland | £751 | not published monthly in PIPR | financial year ending 202420 |
Northern Ireland is reported differently. The ONS affordability statistics put the average monthly rent there at £751 in the financial year ending 2024, with renters spending 25.3% of household income on rent (£751 rent compared with £2,974 income)20. Wales in the same period averaged £702 a month, or 25.9% of private-renting household income20. Within England, the spread is the widest of all: in February 2026 average rent was highest in London (£2,273) and lowest in the North East (£770)2, and the ONS affordability bulletin for the financial year ending 2024 found the most affordable region in England was the North East, with average rents of £641 a month, or 19.8% of private-renter household income5.
London: over £2,300 a month
London sits in a different league from every other region. Average monthly rent in London was £2,332 in August 2026, £2,317 in July 2026, £2,294 in May 2026 and £2,273 in February 2026, always the highest English region and roughly three times the North East figure in the same months4. The Family Resources Survey for 2024 to 2025 found London had the highest median weekly private sector rent, at £345, which was £155 a week higher than the UK median21.
Affordability in London is correspondingly stretched. The ONS found London was the least affordable part of England in the financial year ending 2024, with rents of £1,957 a month, or 41.6% of private-renter household income5. The JRF reports that in 2023-24 private renters in London were spending 46% of their incomes on rent on average12. Private renting is also more common in the capital: the Family Resources Survey for 2023 to 2024 found 28% of London households rented privately, 9 percentage points above the England figure, with a median private sector rent of £333 a week6.
London rent also stands further above social rent than anywhere else in the UK. NISRA analysis of the Family Resources Survey found the highest ratio of private to social rent was in London, at 2.3 times higher, against an overall UK ratio of 1.7 times higher22. A year earlier the same series put the UK ratio at 1.6 times higher, with Wales having the lowest ratio among UK regions at 1.2 times higher24.
New lets and existing tenancies: why the figures differ
The single most important thing to understand about the ONS rent figures is what they count. In England and Wales, achieved rent data are collected for both new and existing tenancies1. In Northern Ireland, rent data are for newly advertised lets1. This matters because most tenancies in any given year are continuing ones, where rents typically rise more slowly than on a fresh let, so an index that includes existing tenancies will usually show a lower average and a lower growth rate than the asking rents on listings.
The practical consequence is that someone starting a new tenancy will often face a rent above the published average for their area, because they are being priced at current market rates rather than at the rate an existing tenant has held for years. The ONS analysis reported by Which? illustrates the stickiness: between February 2022 and February 2023, nearly half of privately rented properties in England (46.6%) saw no change in price at all, while just 2.8% saw a decrease19. A market where half of rents are frozen in any year will have an average well below the price of a new let.
This is also why the ONS figures can look different from the numbers produced by letting agents and property sites, which usually track asking rents on newly advertised properties only. Neither is wrong: they measure different things. The ONS index answers the question "what are tenants paying, across the whole rented stock?", while asking-rent measures answer "what would a new tenancy cost today?". For budgeting a move, the second is the more relevant; for understanding the state of the market, the first.
Revisions and how the index is built
The Price Index of Private Rents measures private rent inflation for new and existing tenancies3. The reference period for indexing is January 2023, and statistics are available from January 20151. Coverage was expanded to the whole of the UK in March 2025, with small improvements made to the Great Britain historical series at the same time7. On 20 May 2026, PIPR data became "official statistics" and are no longer considered to be "in development"4; earlier bulletins, such as the March 2026 edition, still carried the in-development label2.
The figures are provisional for a reason: the UK series has a two-month revision period4, so the latest two months of data can be revised as more rent evidence arrives. The August 2026 average of £1,400 and its 3.8% annual change are both described by the ONS as provisional estimates1, and readers comparing headlines over time should expect small movements in figures first published a month or two earlier.
The underlying rent data come from several sources. For England, private rent prices are sourced from the ONS Private rental market summary statistics (PRMS) bulletin; prior to 2018 these were produced by the Valuation Office Agency25. Income data used in the affordability statistics come from the Family Resources Survey from the Department for Work and Pensions25.
Private rents also feed into the wider inflation statistics. The ONS basket of goods and services includes over 700 items, ranging from food to rents, and around 180,000 prices are collected each month to calculate inflation26. Rents carry particular weight for renter households: the Household Costs Index shows private renter households and social renter households each saw an annual inflation rate of 3.8% in the 12 months to December 2025, and private rental costs contributed 0.20 percentage points to annual HCI inflation across all households, down from 0.28 percentage points27. The Household Costs Index page explains that measure, and how inflation is calculated covers the basket in more detail.
How many households rent privately
Around a fifth of households in the UK rent privately28. The Family Resources Survey for 2023 to 2024 put the percentage of households in the private renting sector at 19%, higher than the 17% in the social rented sector6, and the Bank of England has described the private rented sector as covering around 19% of households29. The share has grown substantially: 5 million households in England and Wales were renting privately in 2021, up from 3.9 million in 201130, and the number of privately rented dwellings has doubled in England since 2001, to 4.9 million, or 20% of all dwellings31.
The sector is also highly mobile. The English Housing Survey for 2024-25 records that 640,000 households moved within the tenure, from one privately rented home to another, and 182,000 new households entered the private rented sector32. That churn is one reason asking rents matter so much: a large share of the market is repriced every year even though most tenancies continue unchanged. Which? notes that with around a fifth of households in the UK privately rented, demand for the right rental home can be high33.
How much of their income renters spend on rent
Rent is the single biggest cost for most private renter households, and the statistics converge on a striking figure. The Resolution Foundation reports that private renters in the UK spend on average 35% of their income on housing costs34. The ONS affordability statistics for England found that a private renter on a median household income could expect to spend 36.3% of their income on an average-priced rented home in the financial year ending 2024 (£1,232 monthly rent compared with £3,396 monthly income)5. The House of Commons Library cites the same 36.3% figure, and the English Housing Survey estimated that private renters aged 16 to 24 spent 46% of their income on rent in 2022/2335.
The burden has grown over time. In the financial year ending March 2021, the ONS found private renters on a median household income could expect to spend 26% of their income on a median-priced rented home in England31, and in the financial year ending 31 March 2022 the figure was 26.1% (£795 rent compared with a £3,050 monthly income)25. Trust for London analysis shows private rents in England as a whole have risen 48% in real terms since 2013/14, after taking account of inflation9. The JRF notes that by 2013-14 private renters were already spending an average of 34% of their income on housing costs, and that renters in 2024-25 were still spending 34% of their incomes on average on rent12.
Pressure is unevenly spread. OECD data in 2023 showed that 23% of UK private renters spend more than 40% of their income on rent, a higher rate than many comparable countries12. The Resolution Foundation found that a 19 to 29-year-old in the private rented sector spent around one-third (34%) of their income on housing costs in 2023-2413. In Scotland, official statistics show people in the private rented sector have spent the highest proportion of their income on housing (26%) of any tenure since 2006/07, and that private rented households in the lowest income quintile were paying an average of almost half (47%) of their household income in housing costs in 2017-2036.
Where free, impartial help exists, it is worth naming. Renters struggling with housing costs can get free advice from Citizens Advice and from housing charities, and benefits such as Universal Credit housing support can help with rent; the JRF and Resolution Foundation work cited here also feeds campaigns on rent affordability and living standards. For the rules on rent increases and your rights as a tenant, the debt section covers where to get free advice if rent arrears build up.
Sources36 cited
- Private rent and house prices, UK: August 2026 ONS, 2026
- Private rent and house prices, UK: March 2026 ONS, 2026
- Private rent and house prices, UK: August 2026 ONS, 2026
- Private rent and house prices, UK: September 2026 ONS, 2026
- Private rental affordability, England: 2024 ONS, 2024
- Family Resources Survey, financial year 2023 to 2024 Department for Work and Pensions, 2024
- Private rent and house prices, UK: June 2026 ONS, 2026
- Housing data: private renting in London Trust for London, 2024
- Rent affordability data Trust for London, 2024
- Private rent and house prices, UK: July 2026 ONS, 2026
- Financial Fairness Tracker wave 9 University of Bristol, 2023
- Under pressure: the affordability challenges facing private renters Joseph Rowntree Foundation, 2026
- Housing Outlook Q2 2025 Resolution Foundation, 2025
- Rebuilding living standards and economic security Joseph Rowntree Foundation, 2026
- The cost of living: ongoing pressures and recent developments Senedd Research, 2026
- Autumn Statement 2023: benefits changes Which?, 2023
- Family Spending 2014, Chapter 2: Housing expenditure ONS, 2014
- Housing Outlook Q3 2022 Resolution Foundation, 2022
- Rents hiked on the majority of homes in the last year: what are your rights Which?, 2023
- Private rental affordability, England, Wales and Northern Ireland: 2024 ONS, 2024
- Family Resources Survey, financial year 2024 to 2025 Department for Work and Pensions, 2025
- Family Resources Survey report 2022/23, Northern Ireland NISRA, 2023
- Family Resources Survey report 2024/25, Northern Ireland NISRA, 2025
- Family Resources Survey report 2023/24, Northern Ireland NISRA, 2024
- Private rental affordability, England: 2022 ONS, 2022
- The impact of inflation: cost of living tracker Trust for London, 2026
- Household Costs Indices for UK household groups, October to December 2025 ONS, 2026
- Financial Stability Report, July 2023 Bank of England, 2023
- Problem debt briefing University of Bristol Personal Finance Research Centre, 2024
- Private rental affordability, England: 2021 ONS, 2021
- English Housing Survey 2024-25, Chapter 3: housing history and future housing MHCLG, 2025
- Renting a home: the first steps Which?, 2026
- Housing Outlook Q2 2026 Resolution Foundation, 2026
- Home ownership in England House of Lords Library, 2025
- Research briefing CBP-10611: private rented sector House of Commons Library, 2024
- Cost of living bill: key statistics Scottish Government, 2022





 MoneyHelperFree, impartial money and pensions guidance, set up by government
 Citizens AdviceFree advice on money, consumer and legal problems in England and Wales
 GOV.UKOfficial information on tax, benefits and government services
 StepChangeFree debt advice and solutions from a charity
 FSCSProtects your money if a bank, insurer or investment firm fails